Customer Feedback
This report helps in the calculation of Key Performance Indicators related to Customer Feedback. It helps to determine things surrounding how happy/disappointed people are with the services and how a property is performing as a whole. The KPIs also help to know which areas or services need improvement and which ones are the solid performers.
Helpful terminologies
Good Threshold: It is a value that helps in determining whether the feedback is positive or negative.
Example: Consider a 3 point rating system: 1,2 and 3 where 3 is the best and 1 is the worst. In this case, if Good Threshold is 2 then positive feedback includes 2 and 3 whereas negative feedback includes only 1. 
Max Rating: Consider a 3 point rating system: 1,2 and 3 where 3 is the best and 1 is the worst. 3 is the Max Rating.
Min Rating: Consider a 3 point rating system: 1,2 and 3 where 3 is the best and 1 is the worst. 1 is the Min Rating.
- The above things are configurable depending on the requirements.
FAQs
-
What is considered as positive Feedback?
Consider a 3 point rating system: 1,2 and 3 where 3 is the best and 1 is the worst. In this case, if Good Threshold is 2 then positive feedback includes 2 and 3. -
What is considered as negative feedback?
Consider a 3 point rating system: 1,2 and 3 where 3 is the best and 1 is the worst. In this case, if Good Threshold is 2 then negative feedback includes 1. - Why do graphs like “Avg. Customer Feedback” and “Ratings Breakdown” change their time intervals depending on the time interval chosen while generating the report?
It is done to facilitate easy viewing and better data ranges depending on the time interval chosen.- If the chosen date range is for a single day, then the data points shown are on an Hourly Basis.
- If the chosen date range is less than a month, then the data points shown are on Daily Basis.
- If the chosen date range is more than a month but less than 3 months, then the data points shown are on Weekly Basis.
- If the chosen date range is more than 3 months, then the data points shown are on a Monthly Basis.
The maximum date range is that of 190 Days for a report that can be provided.
Example: The Date Range below is 1 month. In this case, the time interval for the x-axis of the graph is on daily basis.


-
In the type of graphs mentioned in the previous question, if the date range chosen while generating the report is from 3 Jan to 15 April which means the interval of the graphs will be on monthly basis(Because the number of days is more than 3 months). In that the data presented in Avg. Customer Feedback for the month of April is for the whole of April or only till the 15th of April?
Data shown is always according to the interval provided while generating the report. Even if the column is showing April month in the time range, the data statistics shown is only till 15th of April. -
Suppose in a 3 points-based rating system, 3 being the best and 1 being the worst, the average rating across all the Zones is 3. What is then shown in the “Lowest Rated Zones”?
In this case nothing. We ignore the zones with average ratings equal to the maximum rating. Also in the case of “Top Performing Zones”, we ignore the zones with the average rating equal to the minimum rating. - On what basis are Top performing Zones and Worst performing Zones decided?
The average of the ratings across the zone gives the average rating for that zone. The higher its value, the better it is. Depending on this value the top and worst-performing zones are chosen.
Helpful pointers for understanding some graphs:
-
“Issues Reported” graph helps in understanding for a particular zone how many times has one issue been reported. On the x-axis, we have the zones and on the y-axis, we have different kinds of issues reported.
Example(Graph below): For the “Female Washroom, L2” zone and “Bin Full” issue, the count of issues reported is 4.
-
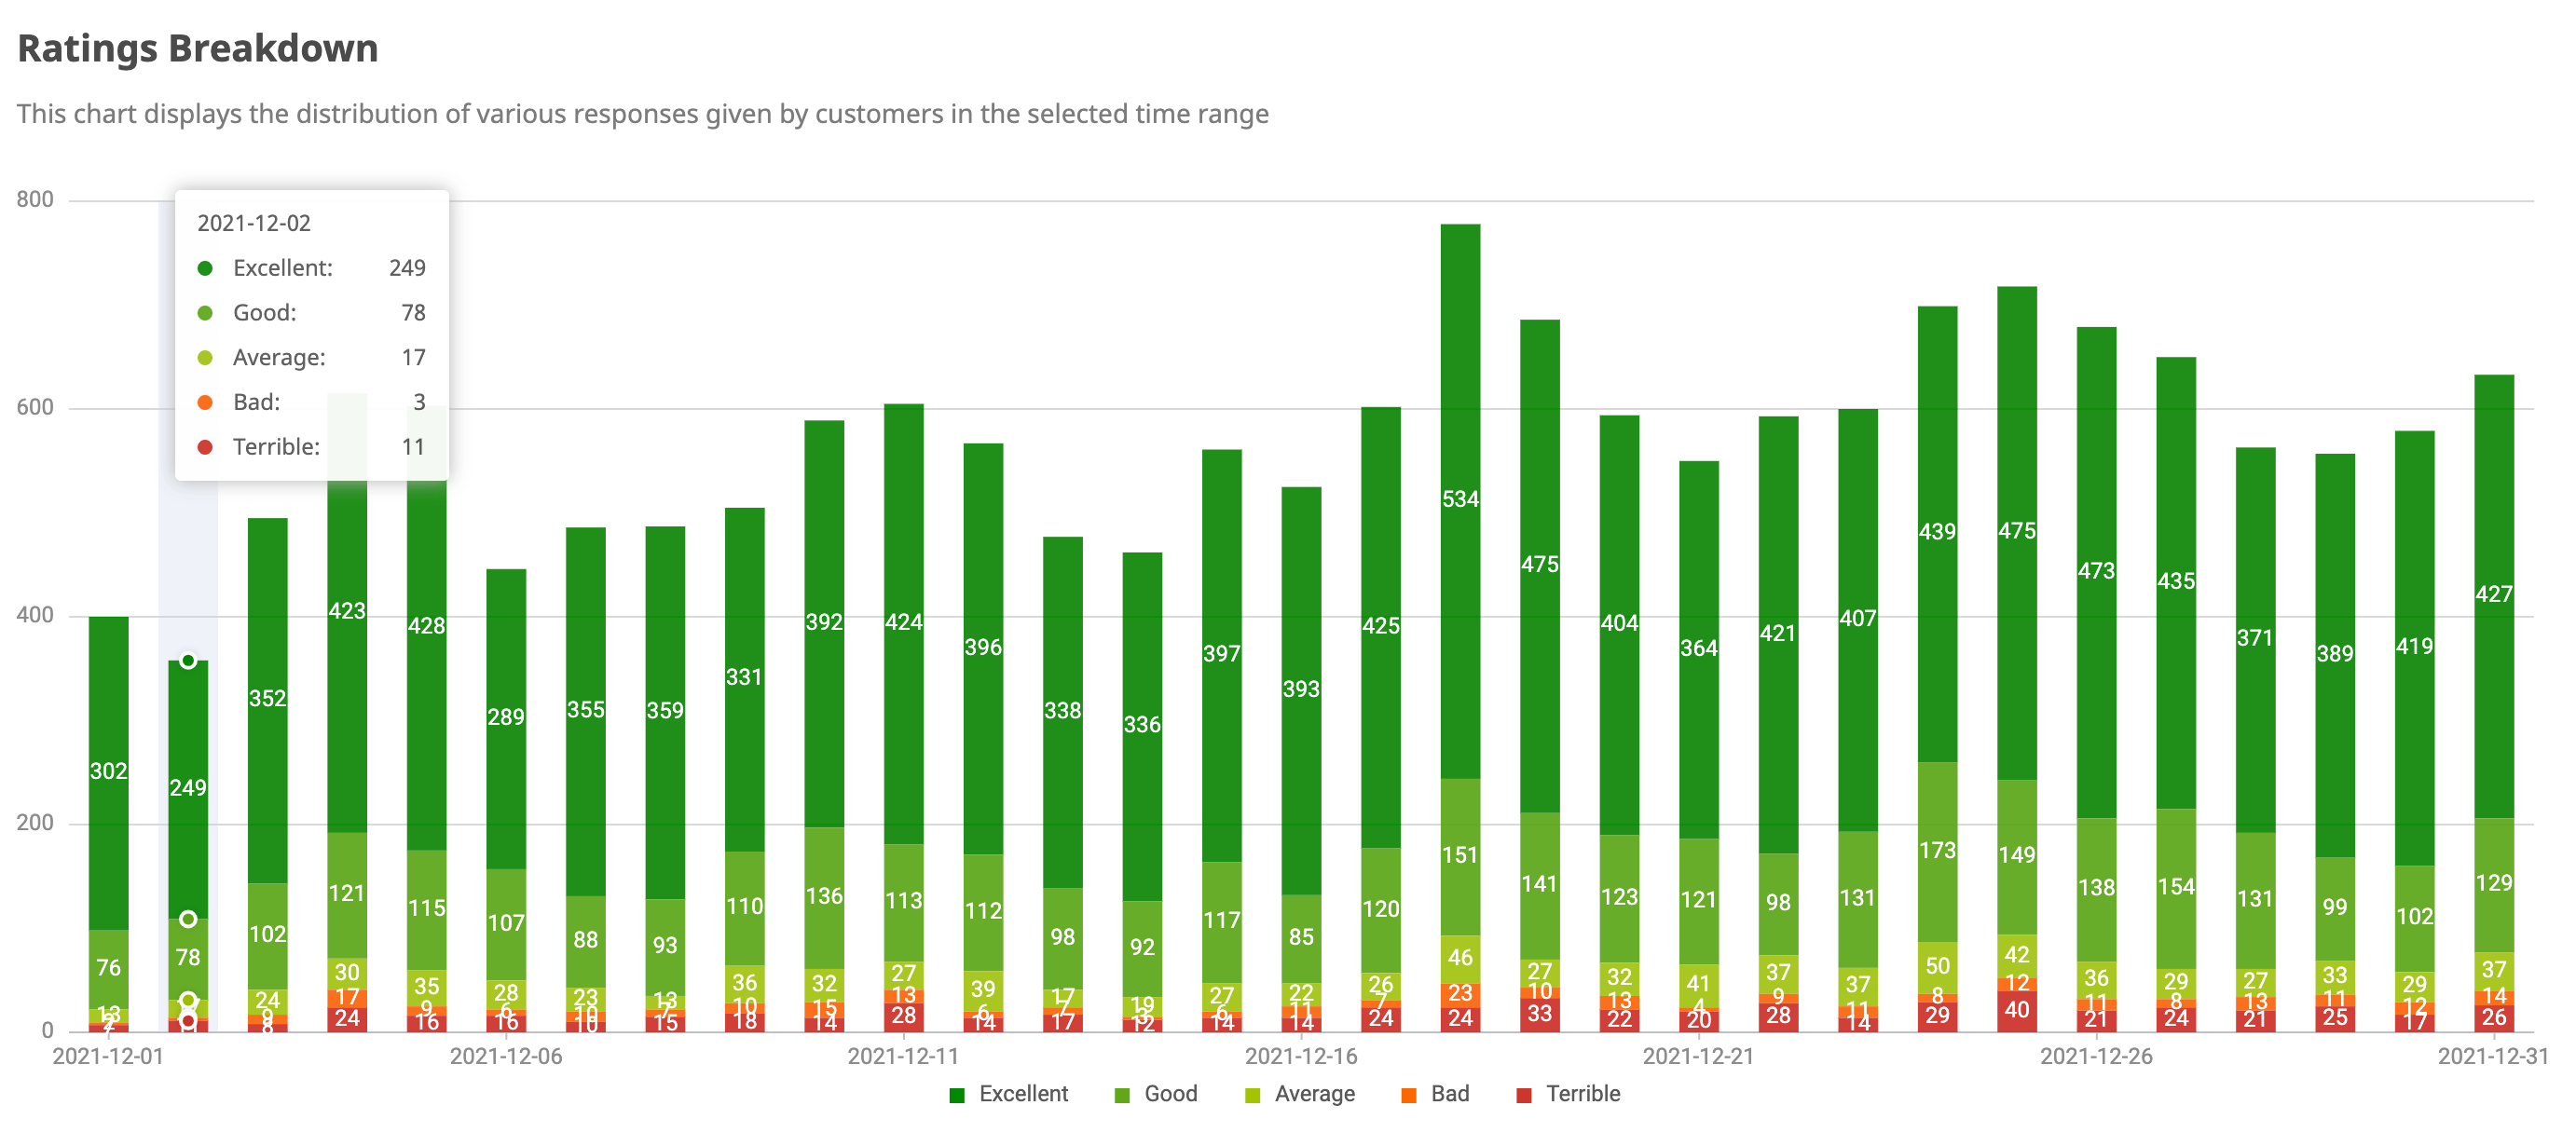
“Ratings Breakdown” graph helps in knowing the number of times a particular rating was chosen on a particular day.
Example(Graph below): On 2021-12-02, “Excellent” Rating has been given 249 times.