Links to analytical dashboards
Use this option to generate web links that open analytical dashboards for your Property.
Solution:
SmartClean embeddable BI dashboards.
Outcome:
- BI Dashboard links can be opened from anywhere there is internet access
- You can embed such links in your own user interfaces
- Cross-origin request issues will not happen, since we allow any host to embed the signed URLs.
- Supplement your own reporting and BI requirements with these dashboards
Setup and activation:
To set up and use Embeddable BI dashboards from your SmartClean enabled Property:
- Please open a support ticket with us, or
- Contact your SmartClean account manager.
Steps for integration:
- On-boarding - Creation of your Property.
- Authorization - Receive credentials and steps for access.
- Setup - Set up an environment to make request to our BI service and use the link received in response.
- Validation - Access the dashboard via the link received.
Steps for access:
- You can access this feature after first two steps for integration (above) are complete.
- To receive a link to desired BI dashboard, request our BI web service.
- Refer to documentation for this request here
- The link received in response lets you open this dashboard
- This link is valid for at most 10 minutes.
- After this duration, you need to make a request to our BI service again to generate a link.
- Each link is associated with a user session in our platform (subject quota of active sessions in your Project)
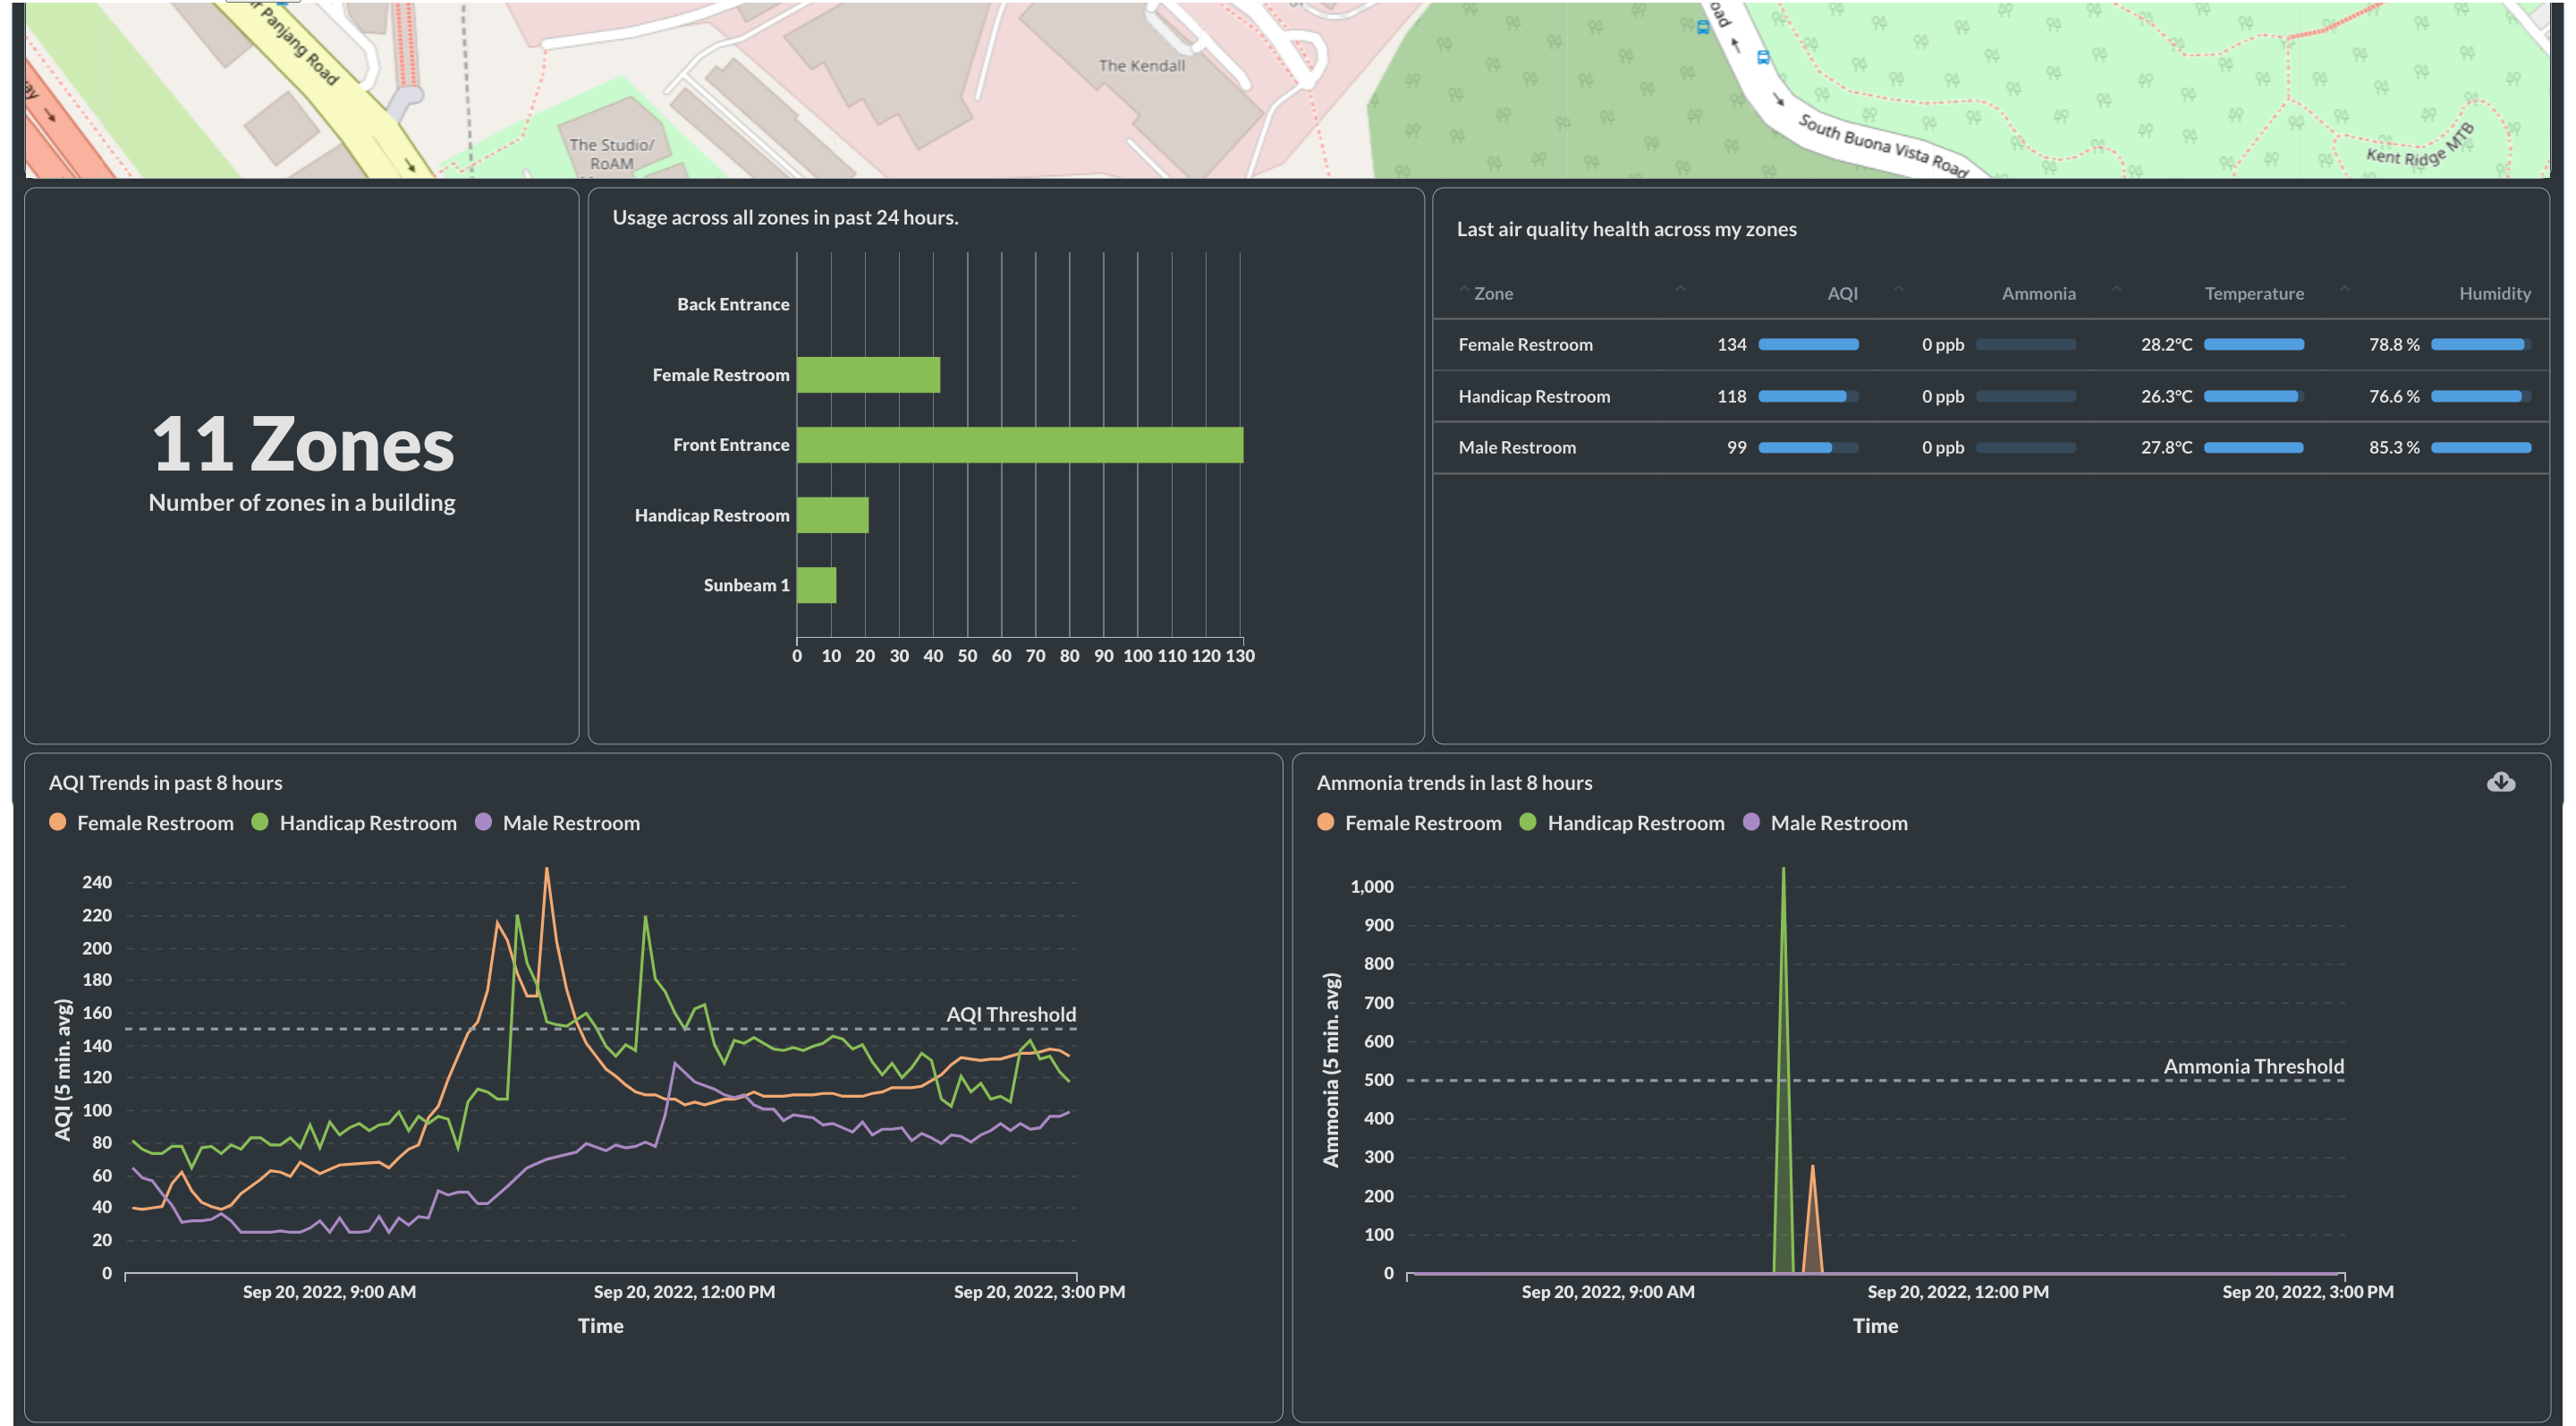
Example Widgets in a Dashboard
- Project location (Map view)
- Number of Zones in the Building (Count)
- Usage across all Zones in past 24 hours (Bar chart)
- Trend of cumulative people count
- Relative usage across all Zones in past 24 hours
- Trend of hourly people count
- Last environment health across all Zones
- Last reported value for following parameters:
- Air Quality Index (if applicable)
- Ammonia (if applicable)
- Temperature
- Humidity
- Last reported value for following parameters:
- Air quality trend in past 8 hours for each Zone
- Trend for Air Quality Index
- Trend for Ammonia
More examples (ESG widgets)
- Ammonia and air quality health in last 8 hours
- Zones with moderate or bad air quality in the last hour.
- Tissue roll usage trends for building in last 3 days.
- Tissue roll usage in last 24 hours across zones
- Average tissue roll refill trends in last 4 days.
- Heatmap of Tissue roll usage across zones.
Frequently asked questions (FAQs)
Visit the FAQ for Embeddable BI Dashboards here
Screenshots
Example dashboard 1, part 1

Example dashboard 1, part 2

Example dashboard 2 (with dark theme)
ESG widgets in dashboard, Part 1

ESG widgets in dashboard, Part 2

ESG widgets in dashboard, Part 3
